

Date: May 2021 - December 2021 | Role: Product Designer
Overview
It's not about usage and data, but thriving together as a team. We had the opportunity to tell a story for Toast community on how to ensure a smooth and successful experience with the use of Performance Center.
The Challenge
How can we use Toast current data to help improve Toast platform and ensure smooth experience for restaurants?
Our main problem was that users struggled to find all their data in a single, centralized location to support their next best action. They often had 5–8 tabs open just to gather and cross-reference information needed to understand their business performance.
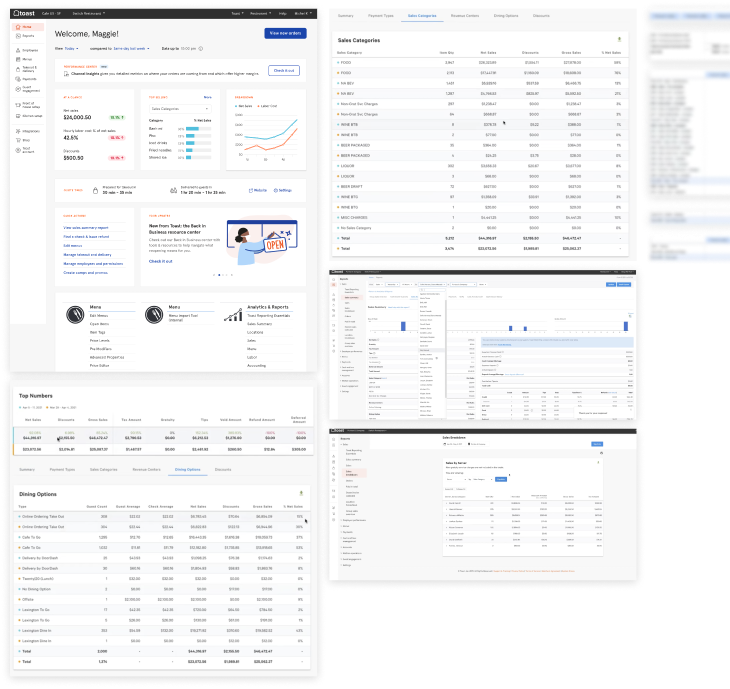
Our Approach Overview
01 | Discovery & Research
02 | Iterations & Testing
As part of our process, we began with stakeholder interviews to understand how successful restaurant owners — from small independents to larger chains — think about and manage their businesses. Once we had a grasp of their thought processes, we developed several design solutions informed by their feedback.
Our primary goal was to test which metrics provided the right amount of actionable information to be most helpful for owners and managers.
By transforming these ideas into tangible prototypes, we were able to gather valuable reactions and insights, which increased value both internally (for our teams) and externally (for our users). The concepts and prototypes we shared with participants covered multiple areas of business performance, including sales and marketing, channel optimization, employee satisfaction, loyalty programs, and a profit-and-loss (P&L) dashboard.
01 | First thing first...
Discovery & Research
We had the opportunity to interview Ming, from whom we gathered many valuable insights that helped shape our design solutions.
Through our conversations, we learned that Ming relied on third-party tools to fill gaps in data that Toast did not currently provide. Based on this discovery, we decided to incorporate similar features to deliver more actionable and insightful data, helping restaurant owners better understand their business performance.
Specifically, Ming used 7Shifts and KitchenSync as his top two third-party tools to gain a holistic view of his operations. Capturing some of the real-time data Ming needed has helped us start thinking through how to integrate those capabilities into our design solutions.

For Toast users, data isn’t just numbers —
it tells a story.
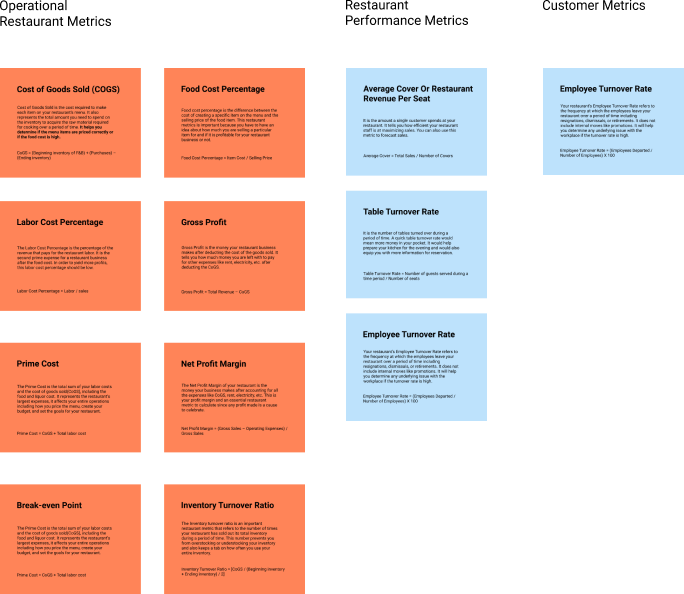
Understanding key terms and metrics was essential for us to speak the same language as our clients — Toast business owners and managers.
During the discovery phase, it was crucial to learn what these metrics meant from our users’ perspective, as well as how they informed their decision-making. I gathered insights on each metric and its underlying formulas to help our team better interpret the data Toast was collecting.
02 | The power of prototyping & iterating
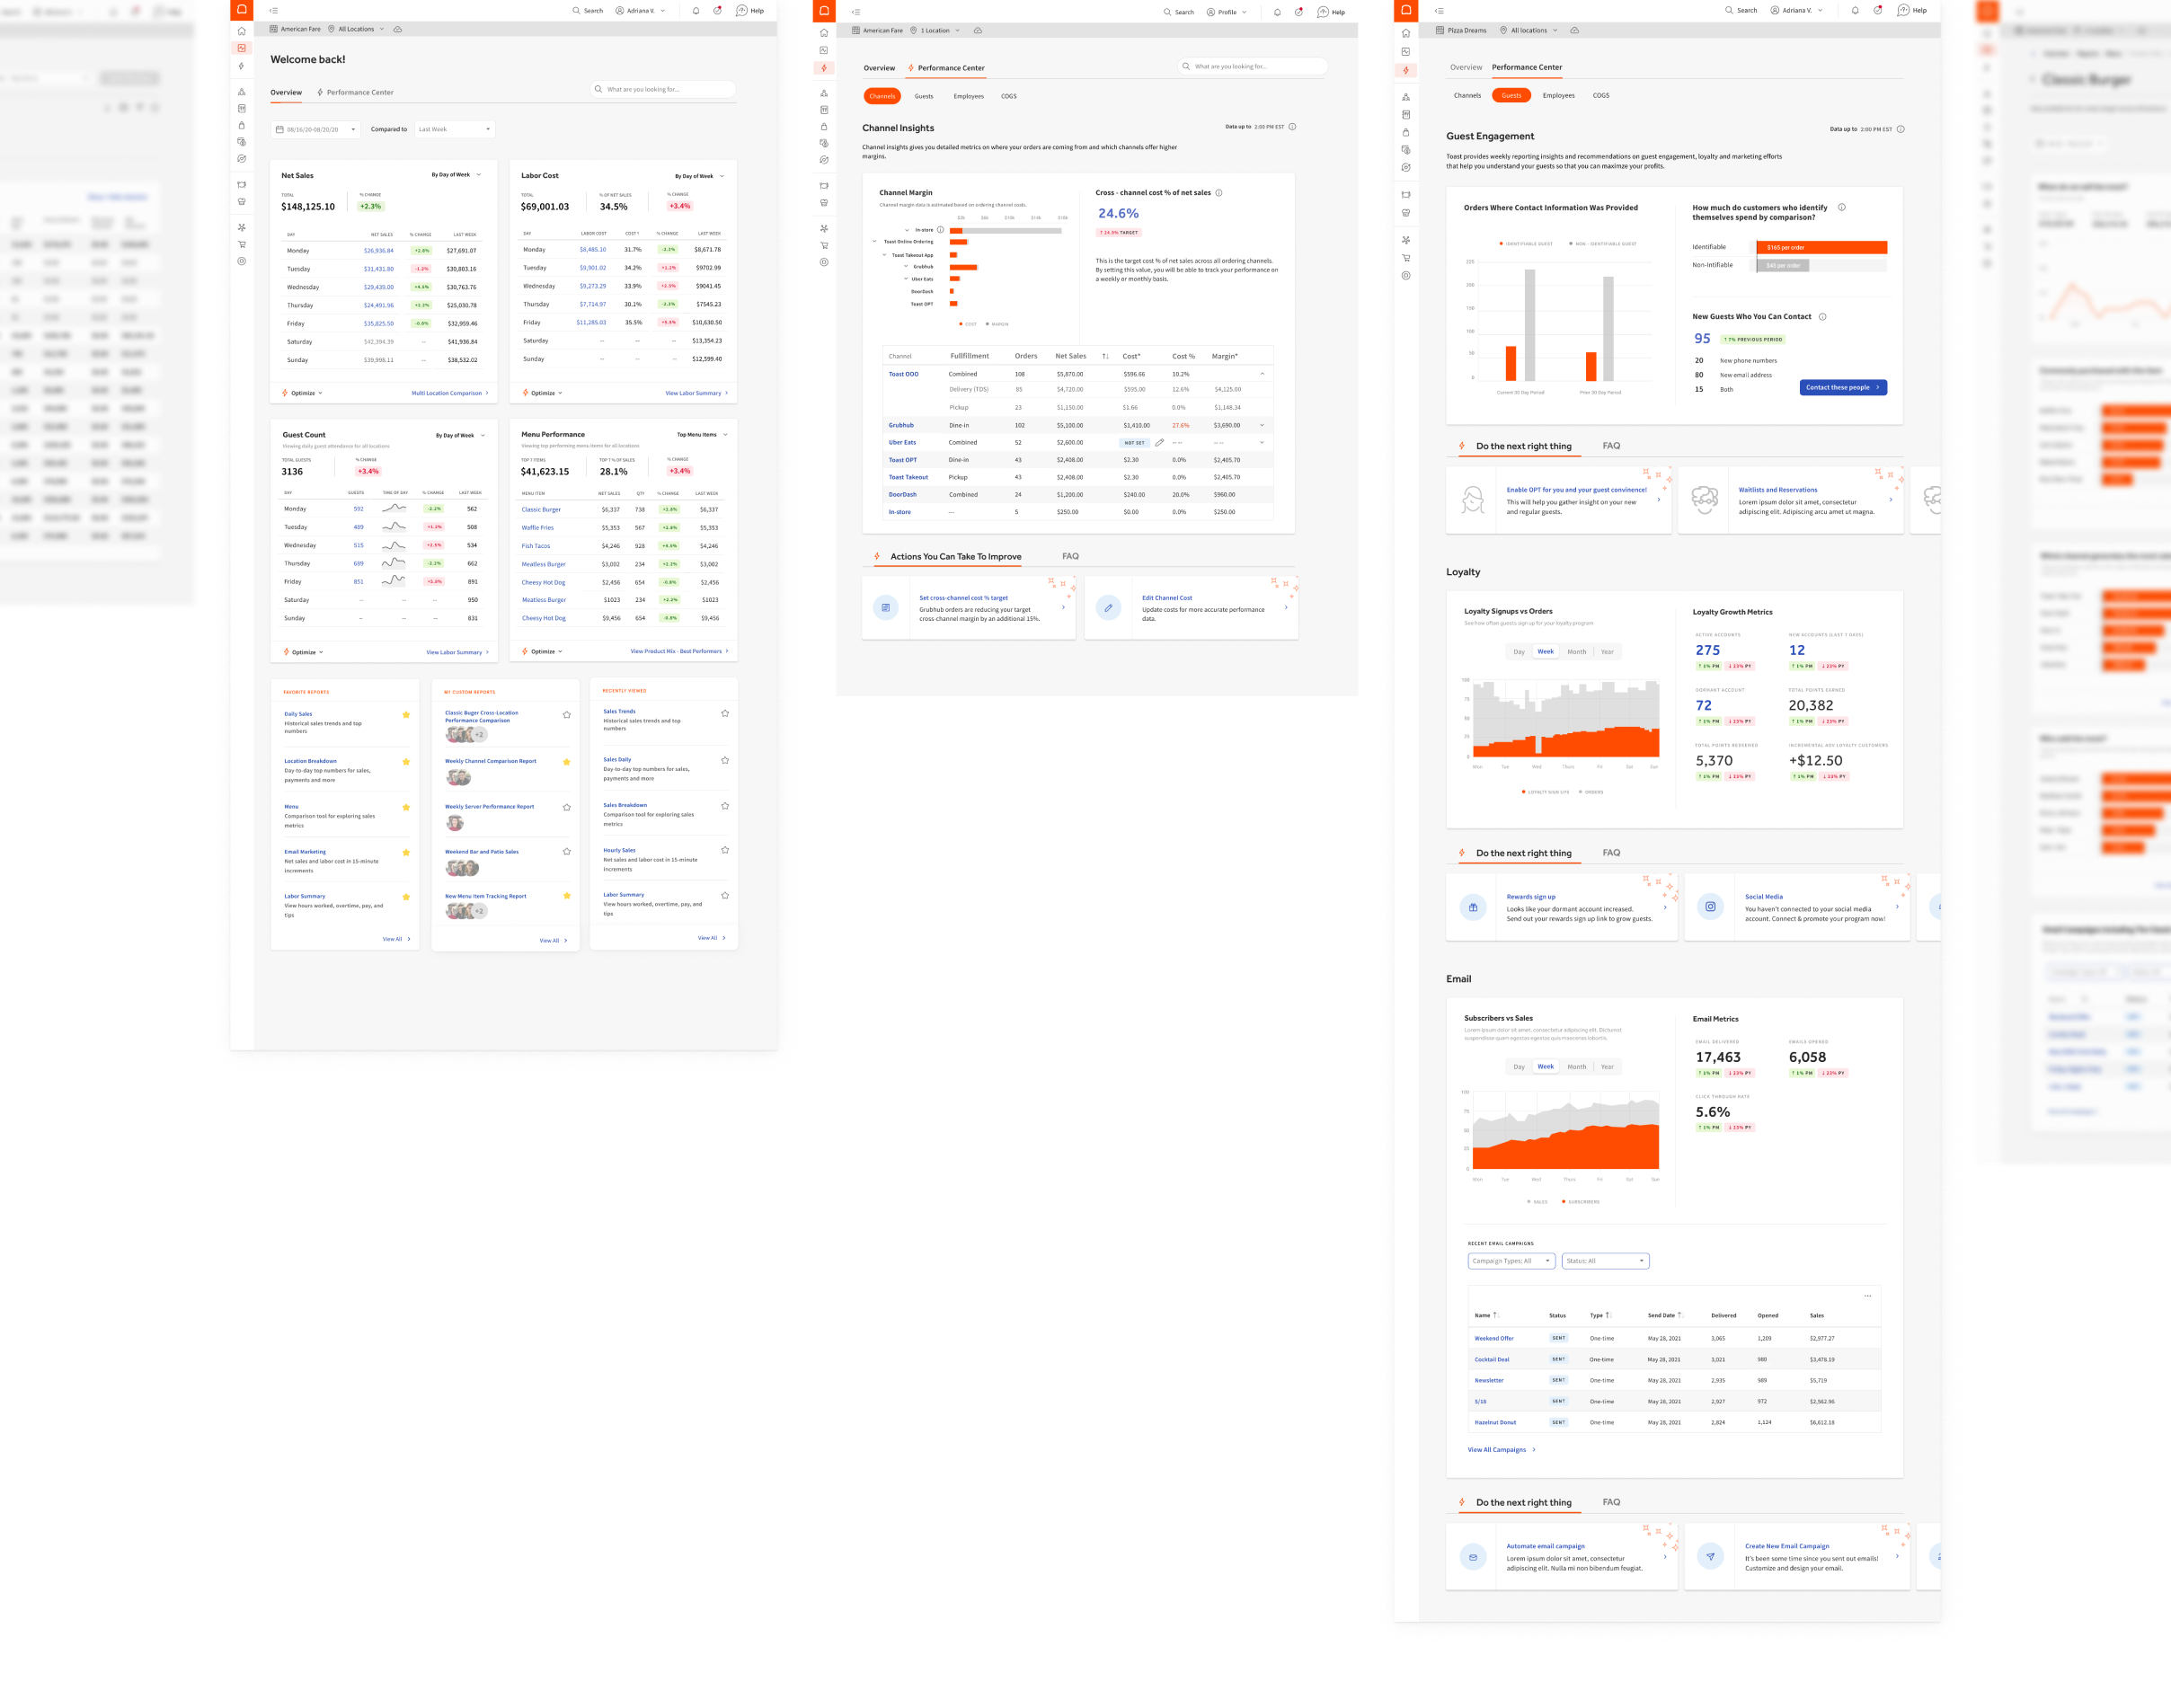
Reporting Homepage
A picture is worth a thousand words, a prototype is worth a thousand zoom calls.

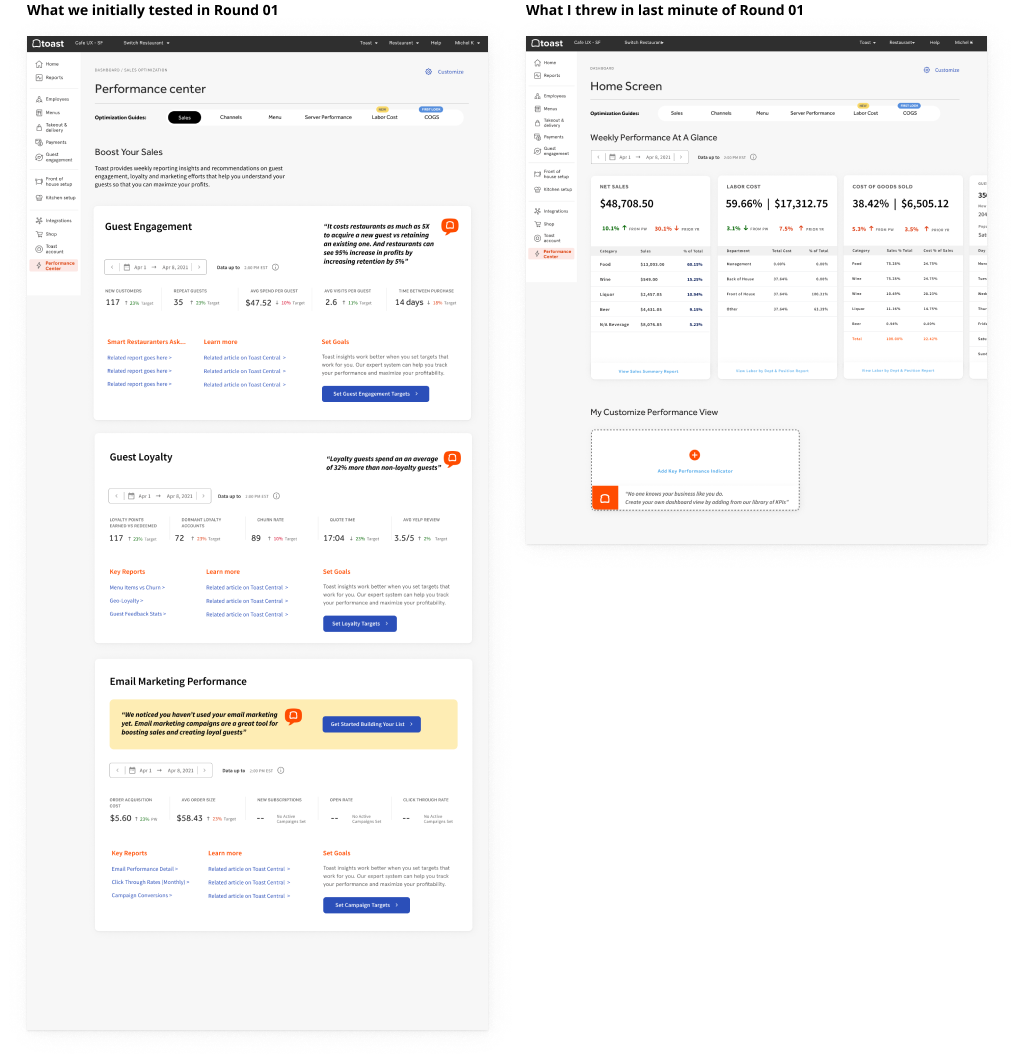
Our clients initially believed they needed a Performance Center right from the start. However, through stakeholder interviews, I discovered their deeper challenge: they struggled to drill down to specific metrics, which made me consider what information users would need to see upfront before deciding to optimize within the Performance Center.
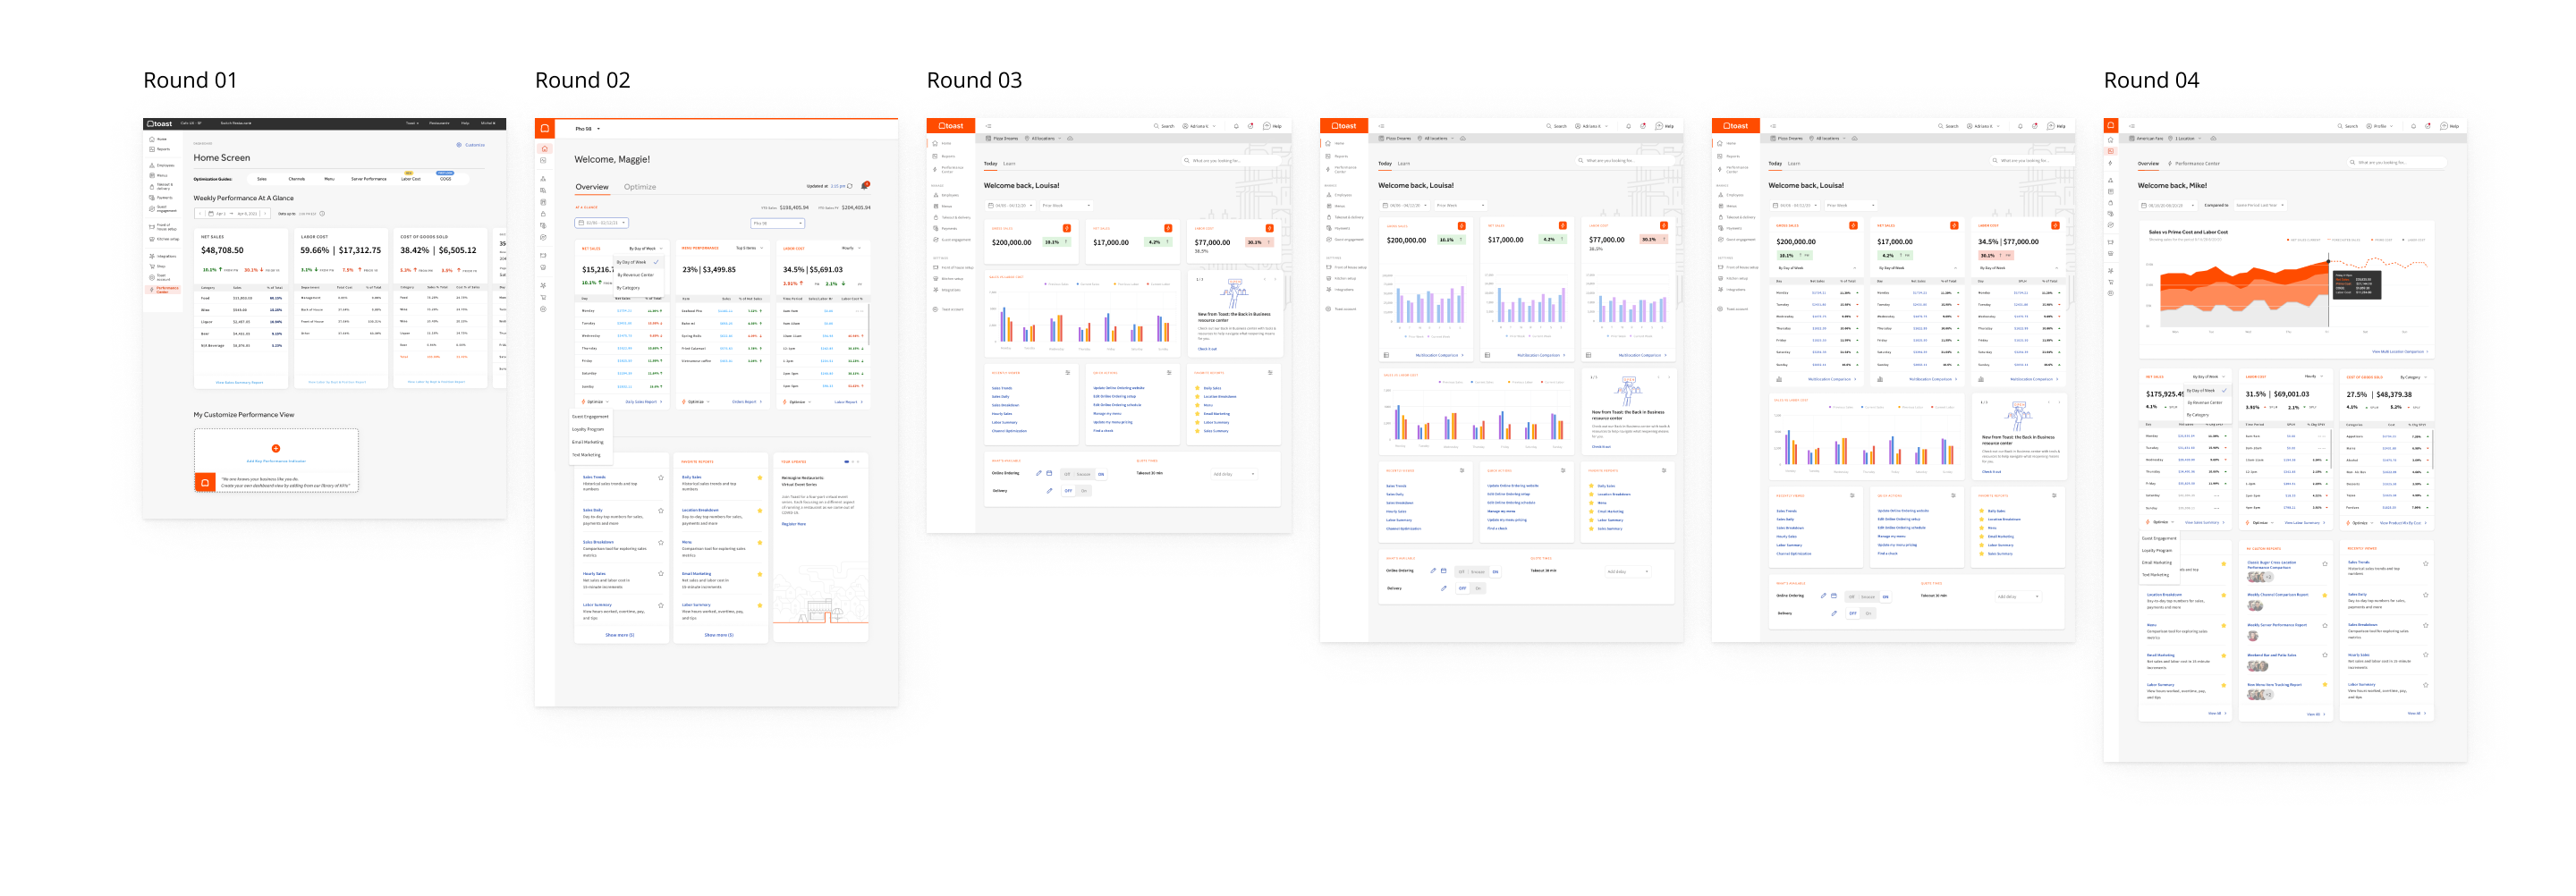
After designing the Performance Center landing page, I explored multiple iterations for presenting a quick, high-level overview on the homepage. Overall, we conducted four rounds of testing, incorporating feedback and refining the designs to best fit users’ needs.
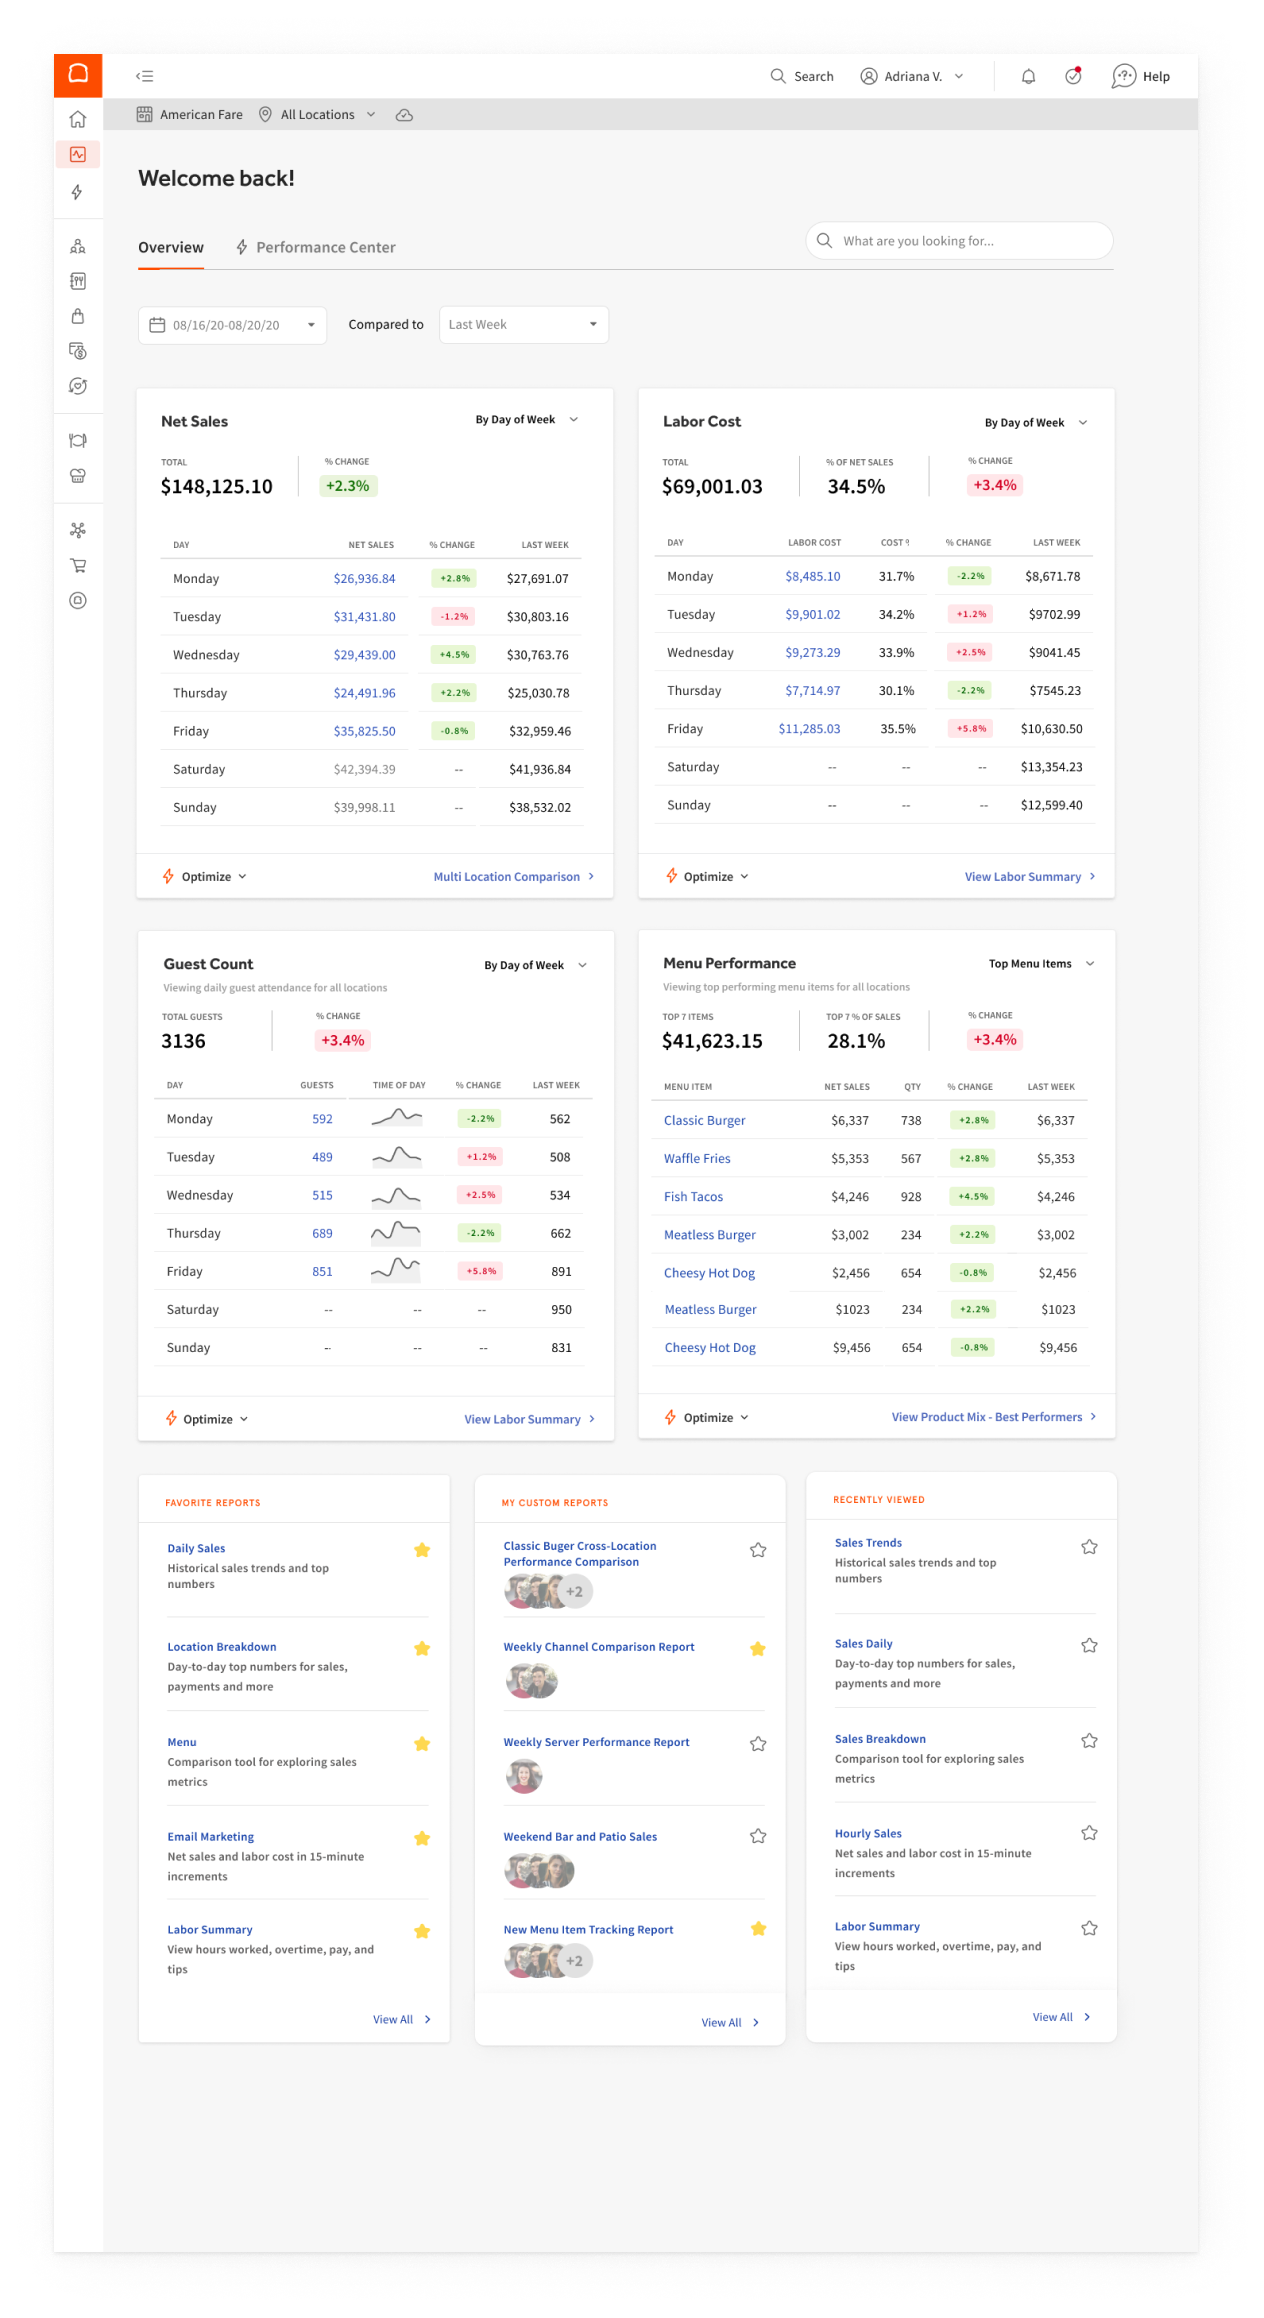
Due to the amount of information that needed to be displayed — along with the requirement to change views within each card — we found that the current card size was too restrictive. As a result, we decided to display all four cards in their expanded state.
“This is clutch”
Users expressed excitement when viewing the dashboard. We learned that prioritizing key metrics for a quick business overview was the most valuable insight.
Users mentioned that managers also need access to this data since it impacts their incentives. Aligning the three cards helps provide a quick overview of whether the business has improved. Being able to view more detailed information per card—by daypart or category—seemed helpful, though it could also be useful to incorporate another timeframe.
Testing Iterations
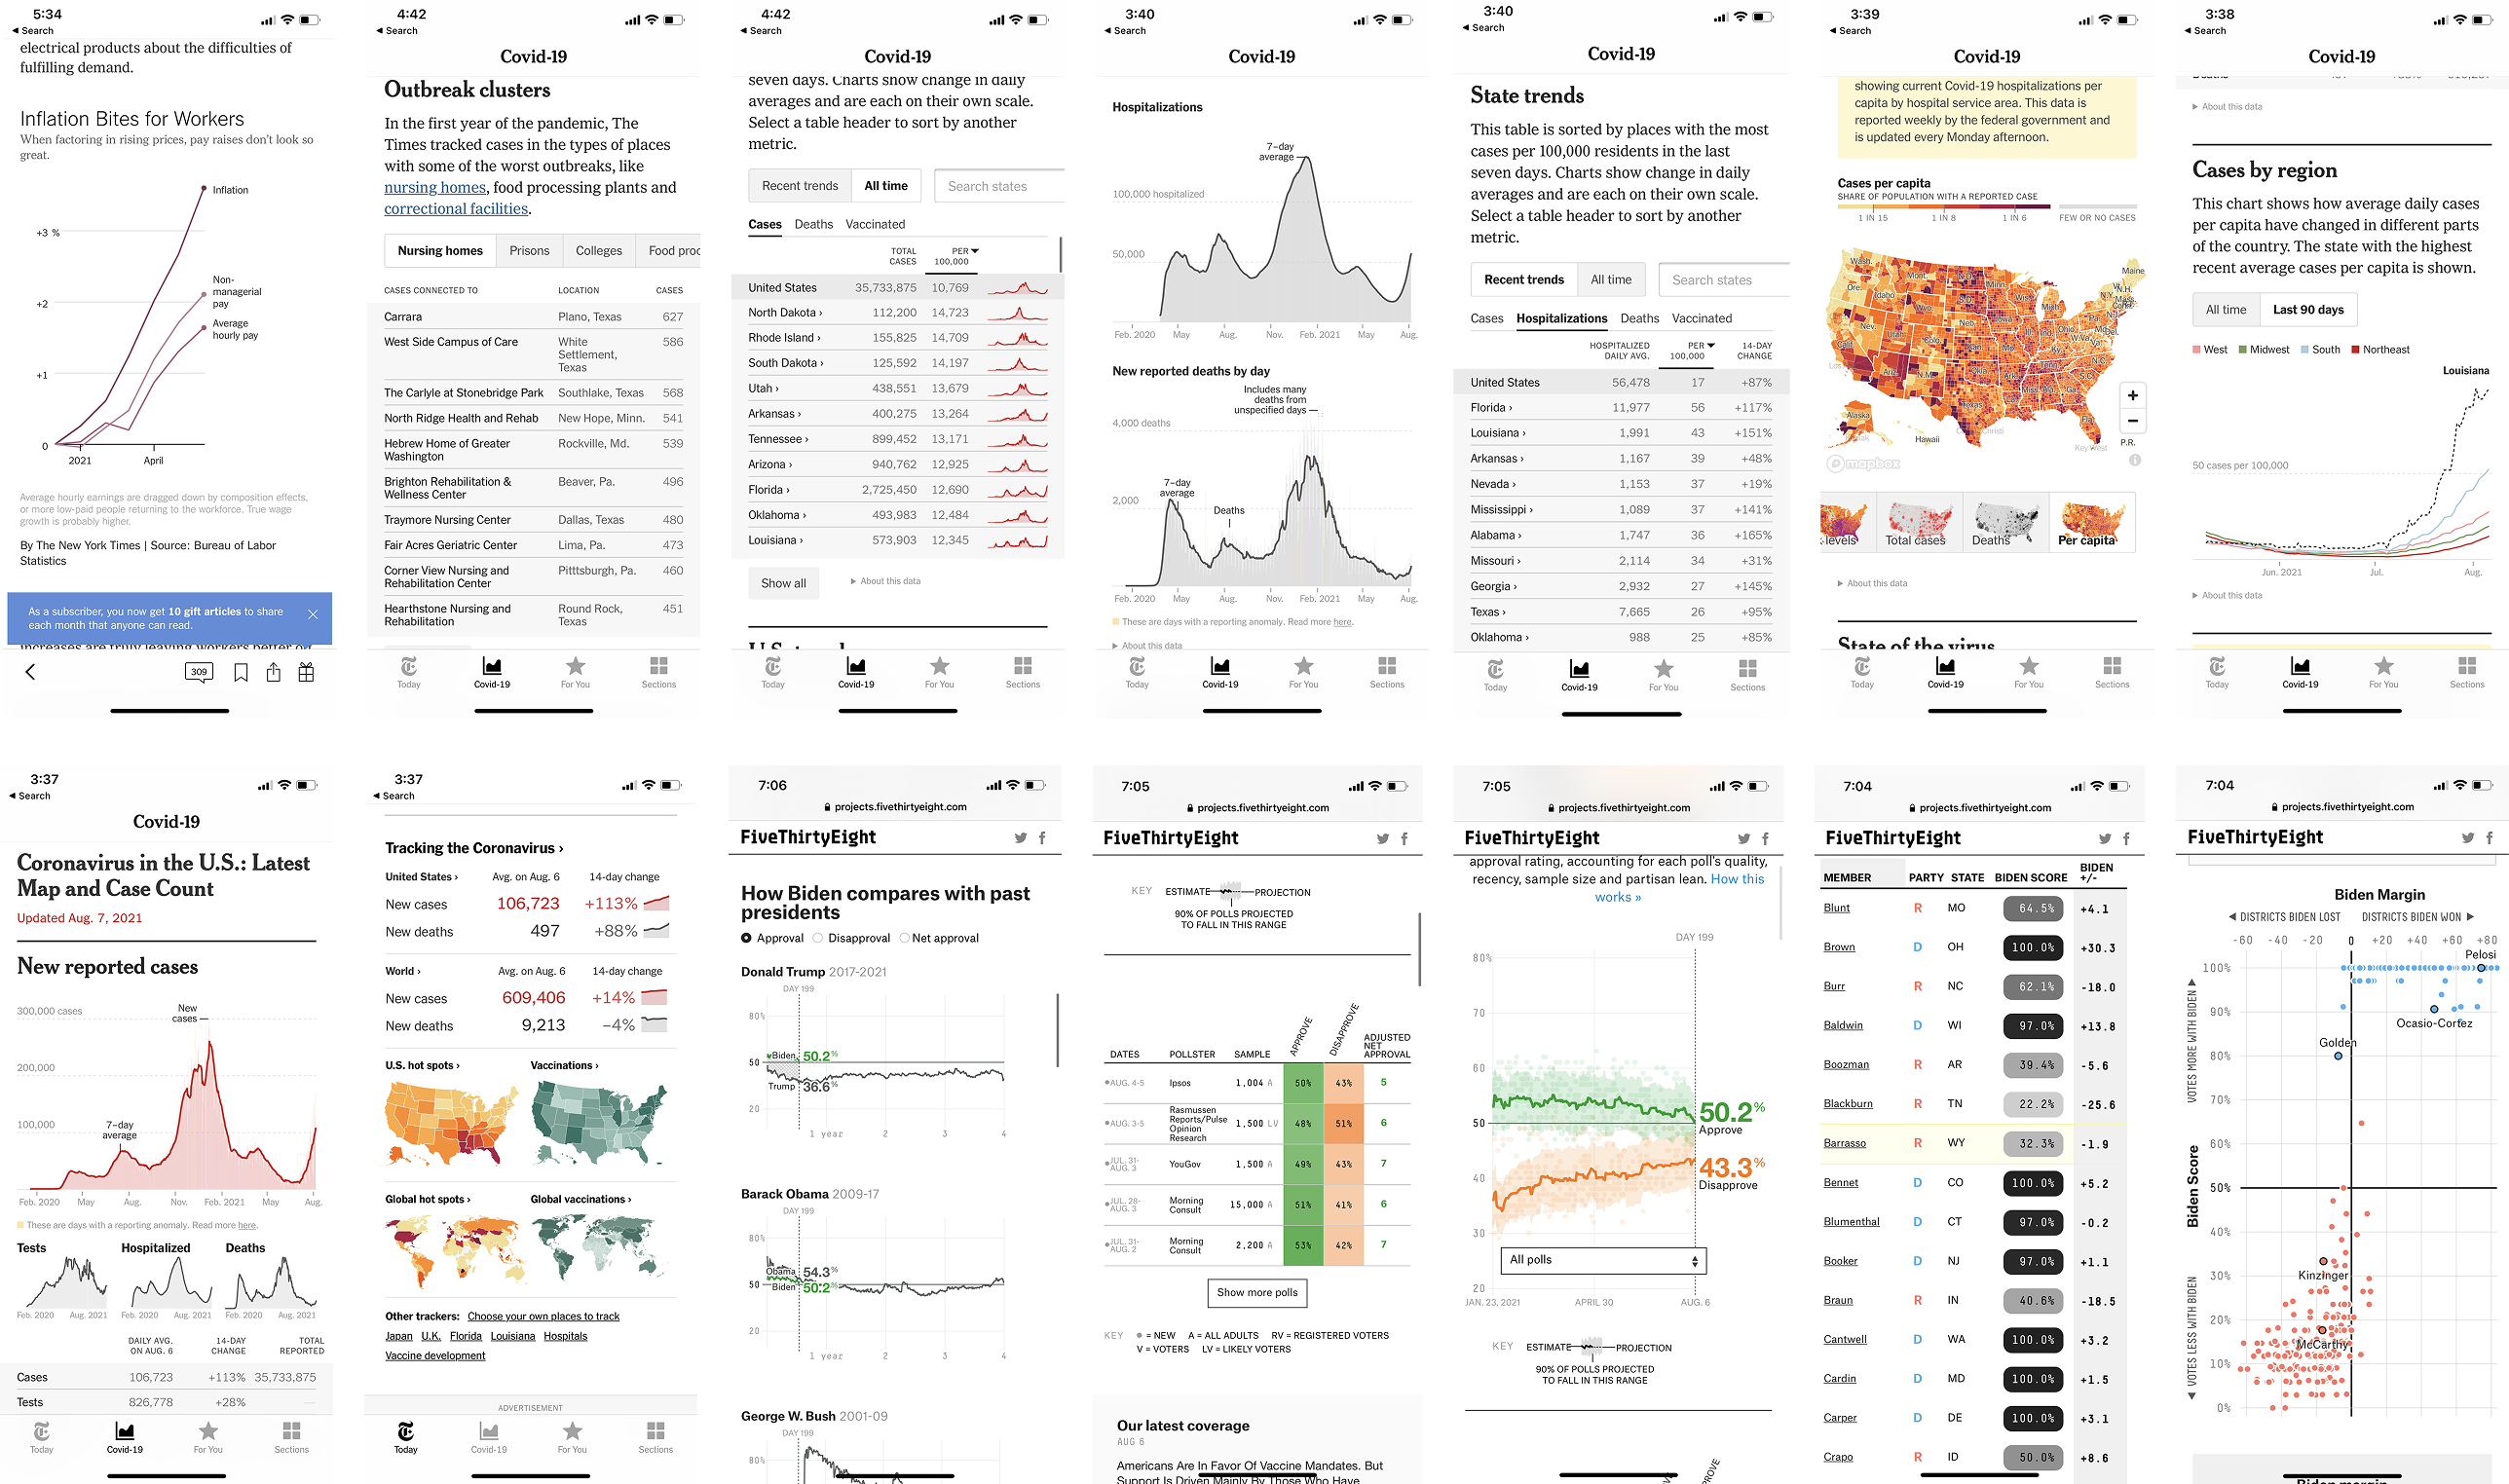
Visualization Research Inspiration
Times & FiveThirtyEight
During the design iteration phase, exploring other data visualization applications helped me generate variations and identify opportunities to integrate into the experience, especially as users drilled down into more granular details.

03 | Human Connection
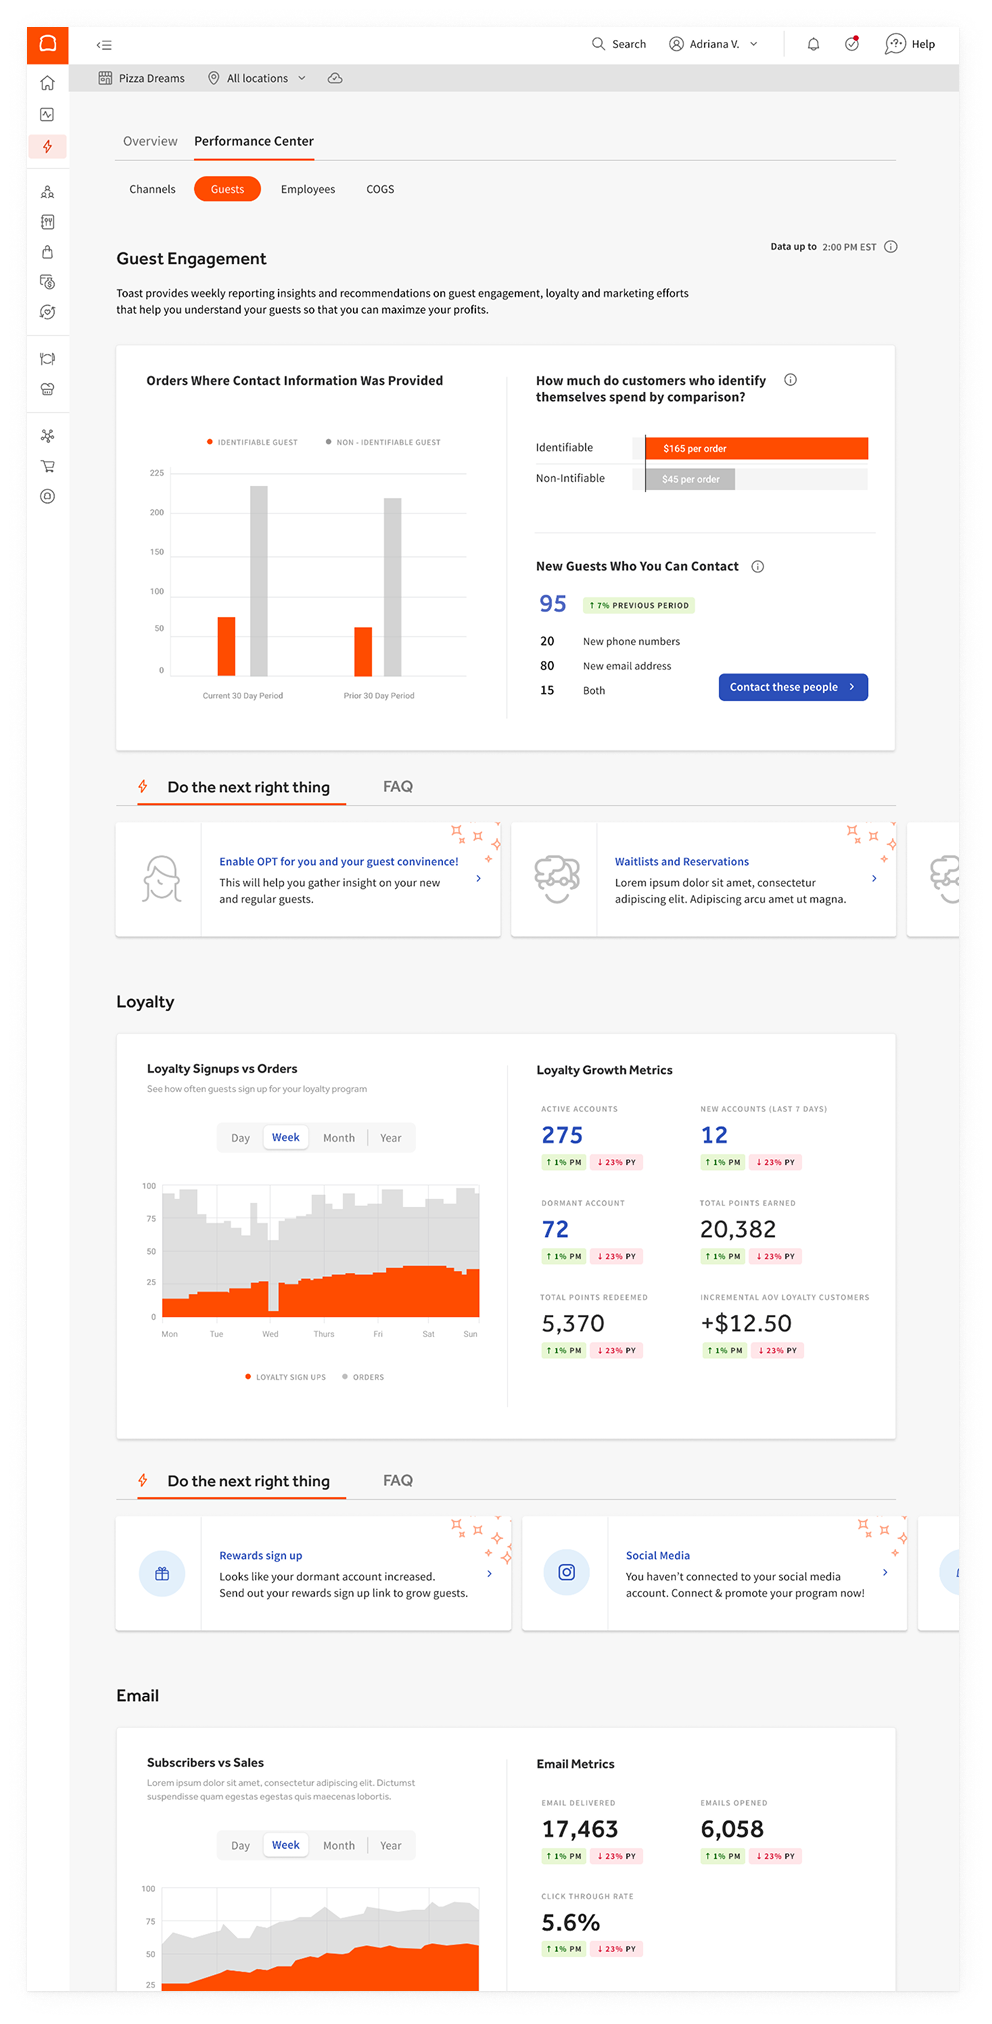
Channels & Guest Performance Center
It’s the genuine emotional connection that makes you stick.

Performance Center was designed to add a human touch—guiding users toward their next best action. Instead of overwhelming them with data, we focused on leveraging it to provide clear, actionable options. This approach helps business owners and managers make faster, more impactful decisions that drive growth.
Findings from resonance testing
Guest engagement metrics are well-organized and valuable for both FSRs and QSRs. Multiple participants expressed interest in having a quick way to market to their loyal customers via email or text—reinforcing that quantifying loyalty activity can inspire clear, actionable next steps.
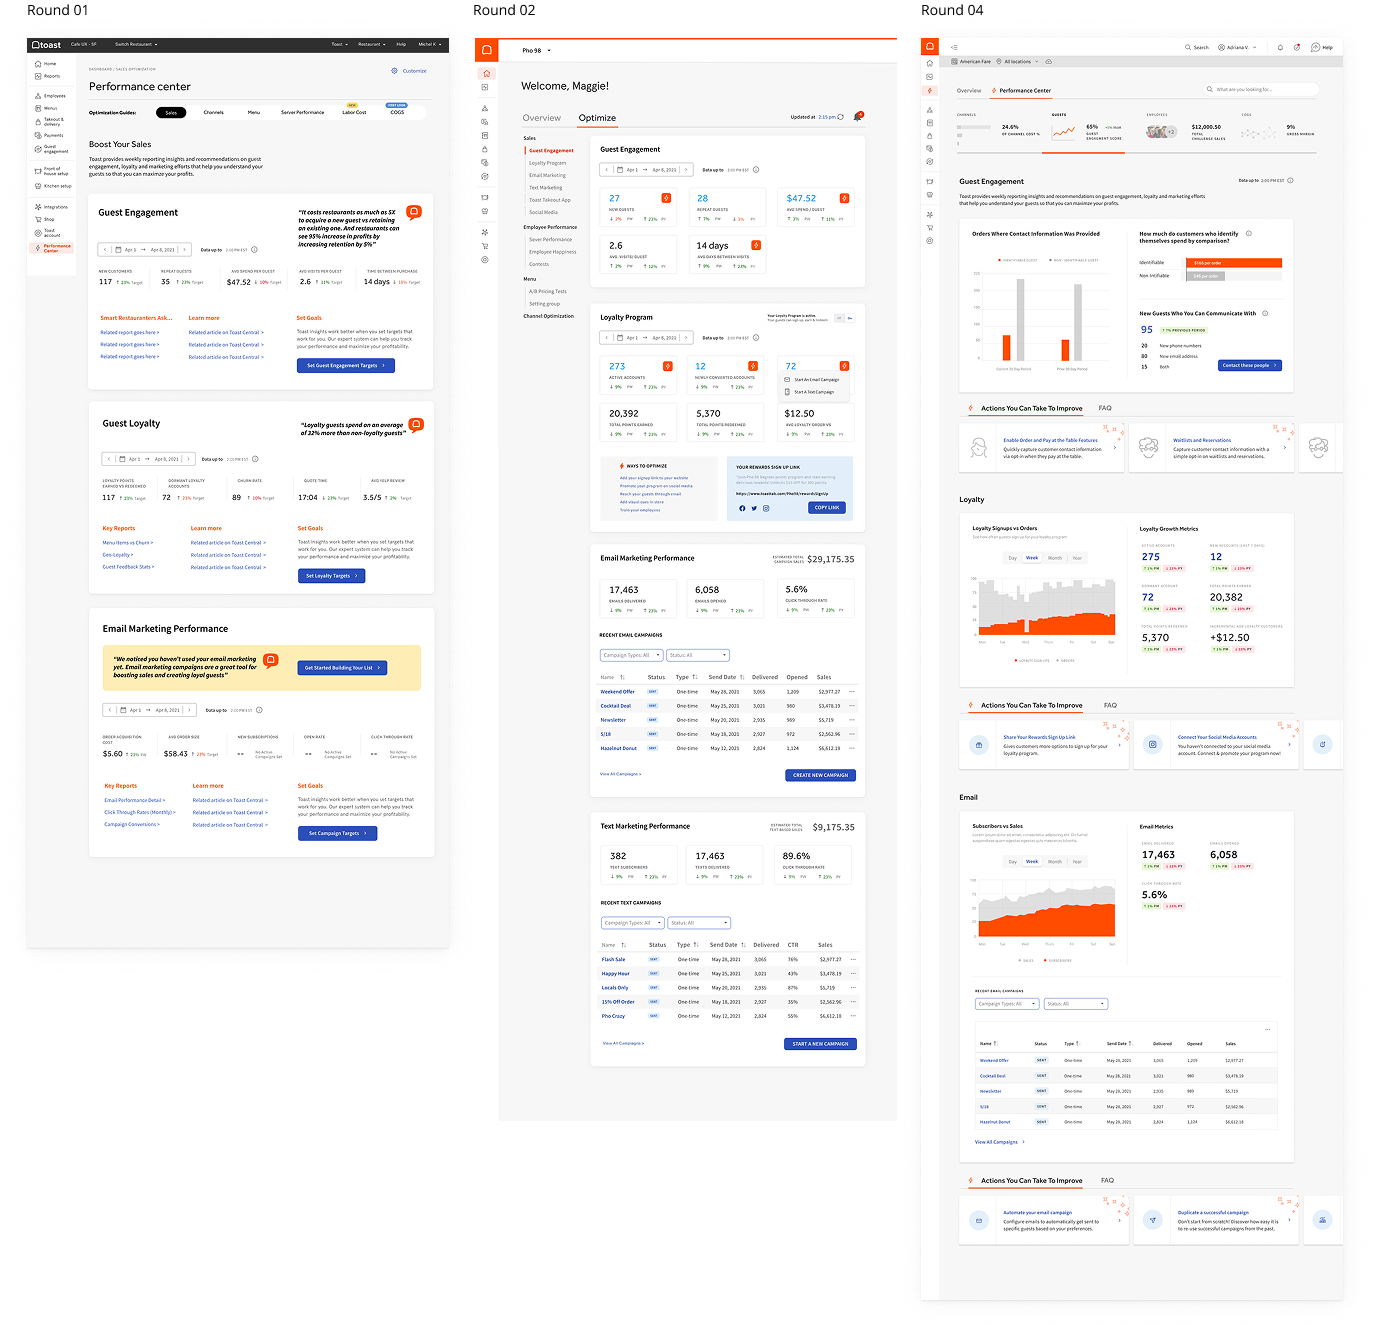
Couple iterations on how we conveyed best next action.
Early versions included links and interactive goal-setting to guide users, but they still felt like raw data dumps—lacking the actionable direction needed to create real impact.
Evolution of Best Next Actions
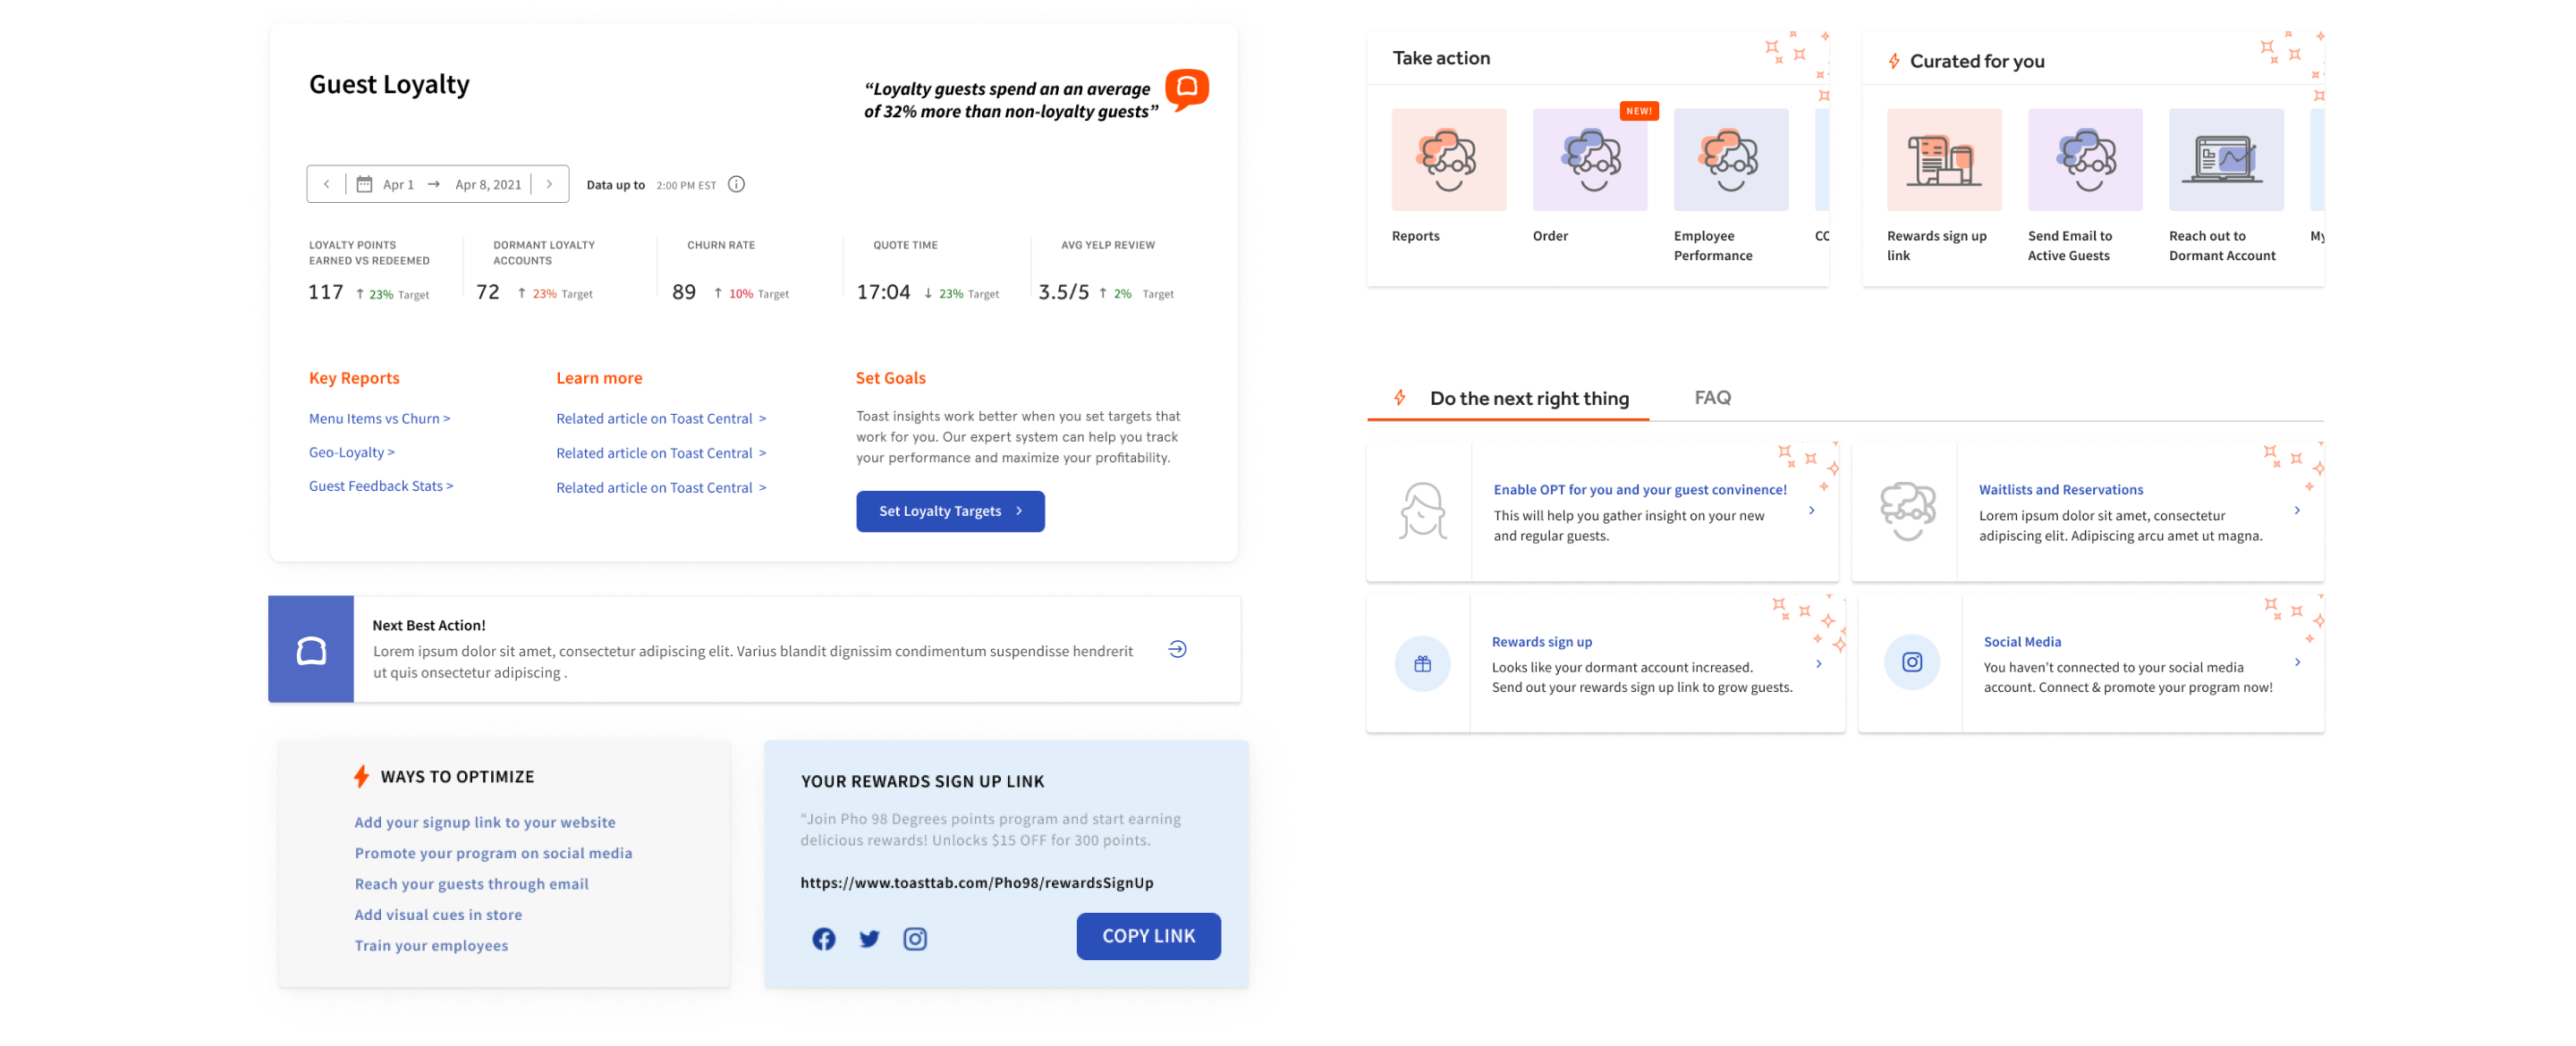
Testing Iterations
04 | Overall
Take Away...
Businesses are unique & Toast will need to shepherd from insight to engagement
Our goal was to influence the Toast team to elevate the Performance Center by leveraging their data more effectively. We gathered insights through rapid prototyping and resonance testing. Through this process, we discovered that every business is unique in its needs and operations. Our key recommendation is to surface simple trends and period comparisons to create a more meaningful experience. This empowers users to optimize their business performance over time.
Toast also needs to take on the role of an educator when presenting important metrics—not just helping users understand the value and meaning of the data, but guiding them toward actionable decisions. Why? Because many users won’t know what to look for, and they won’t have time to figure it out on their own. This approach will help close the gap between curiosity and clarity—the moment of wondering what's happening and the moment of insight. Time = Money. Trust = Loyalty.
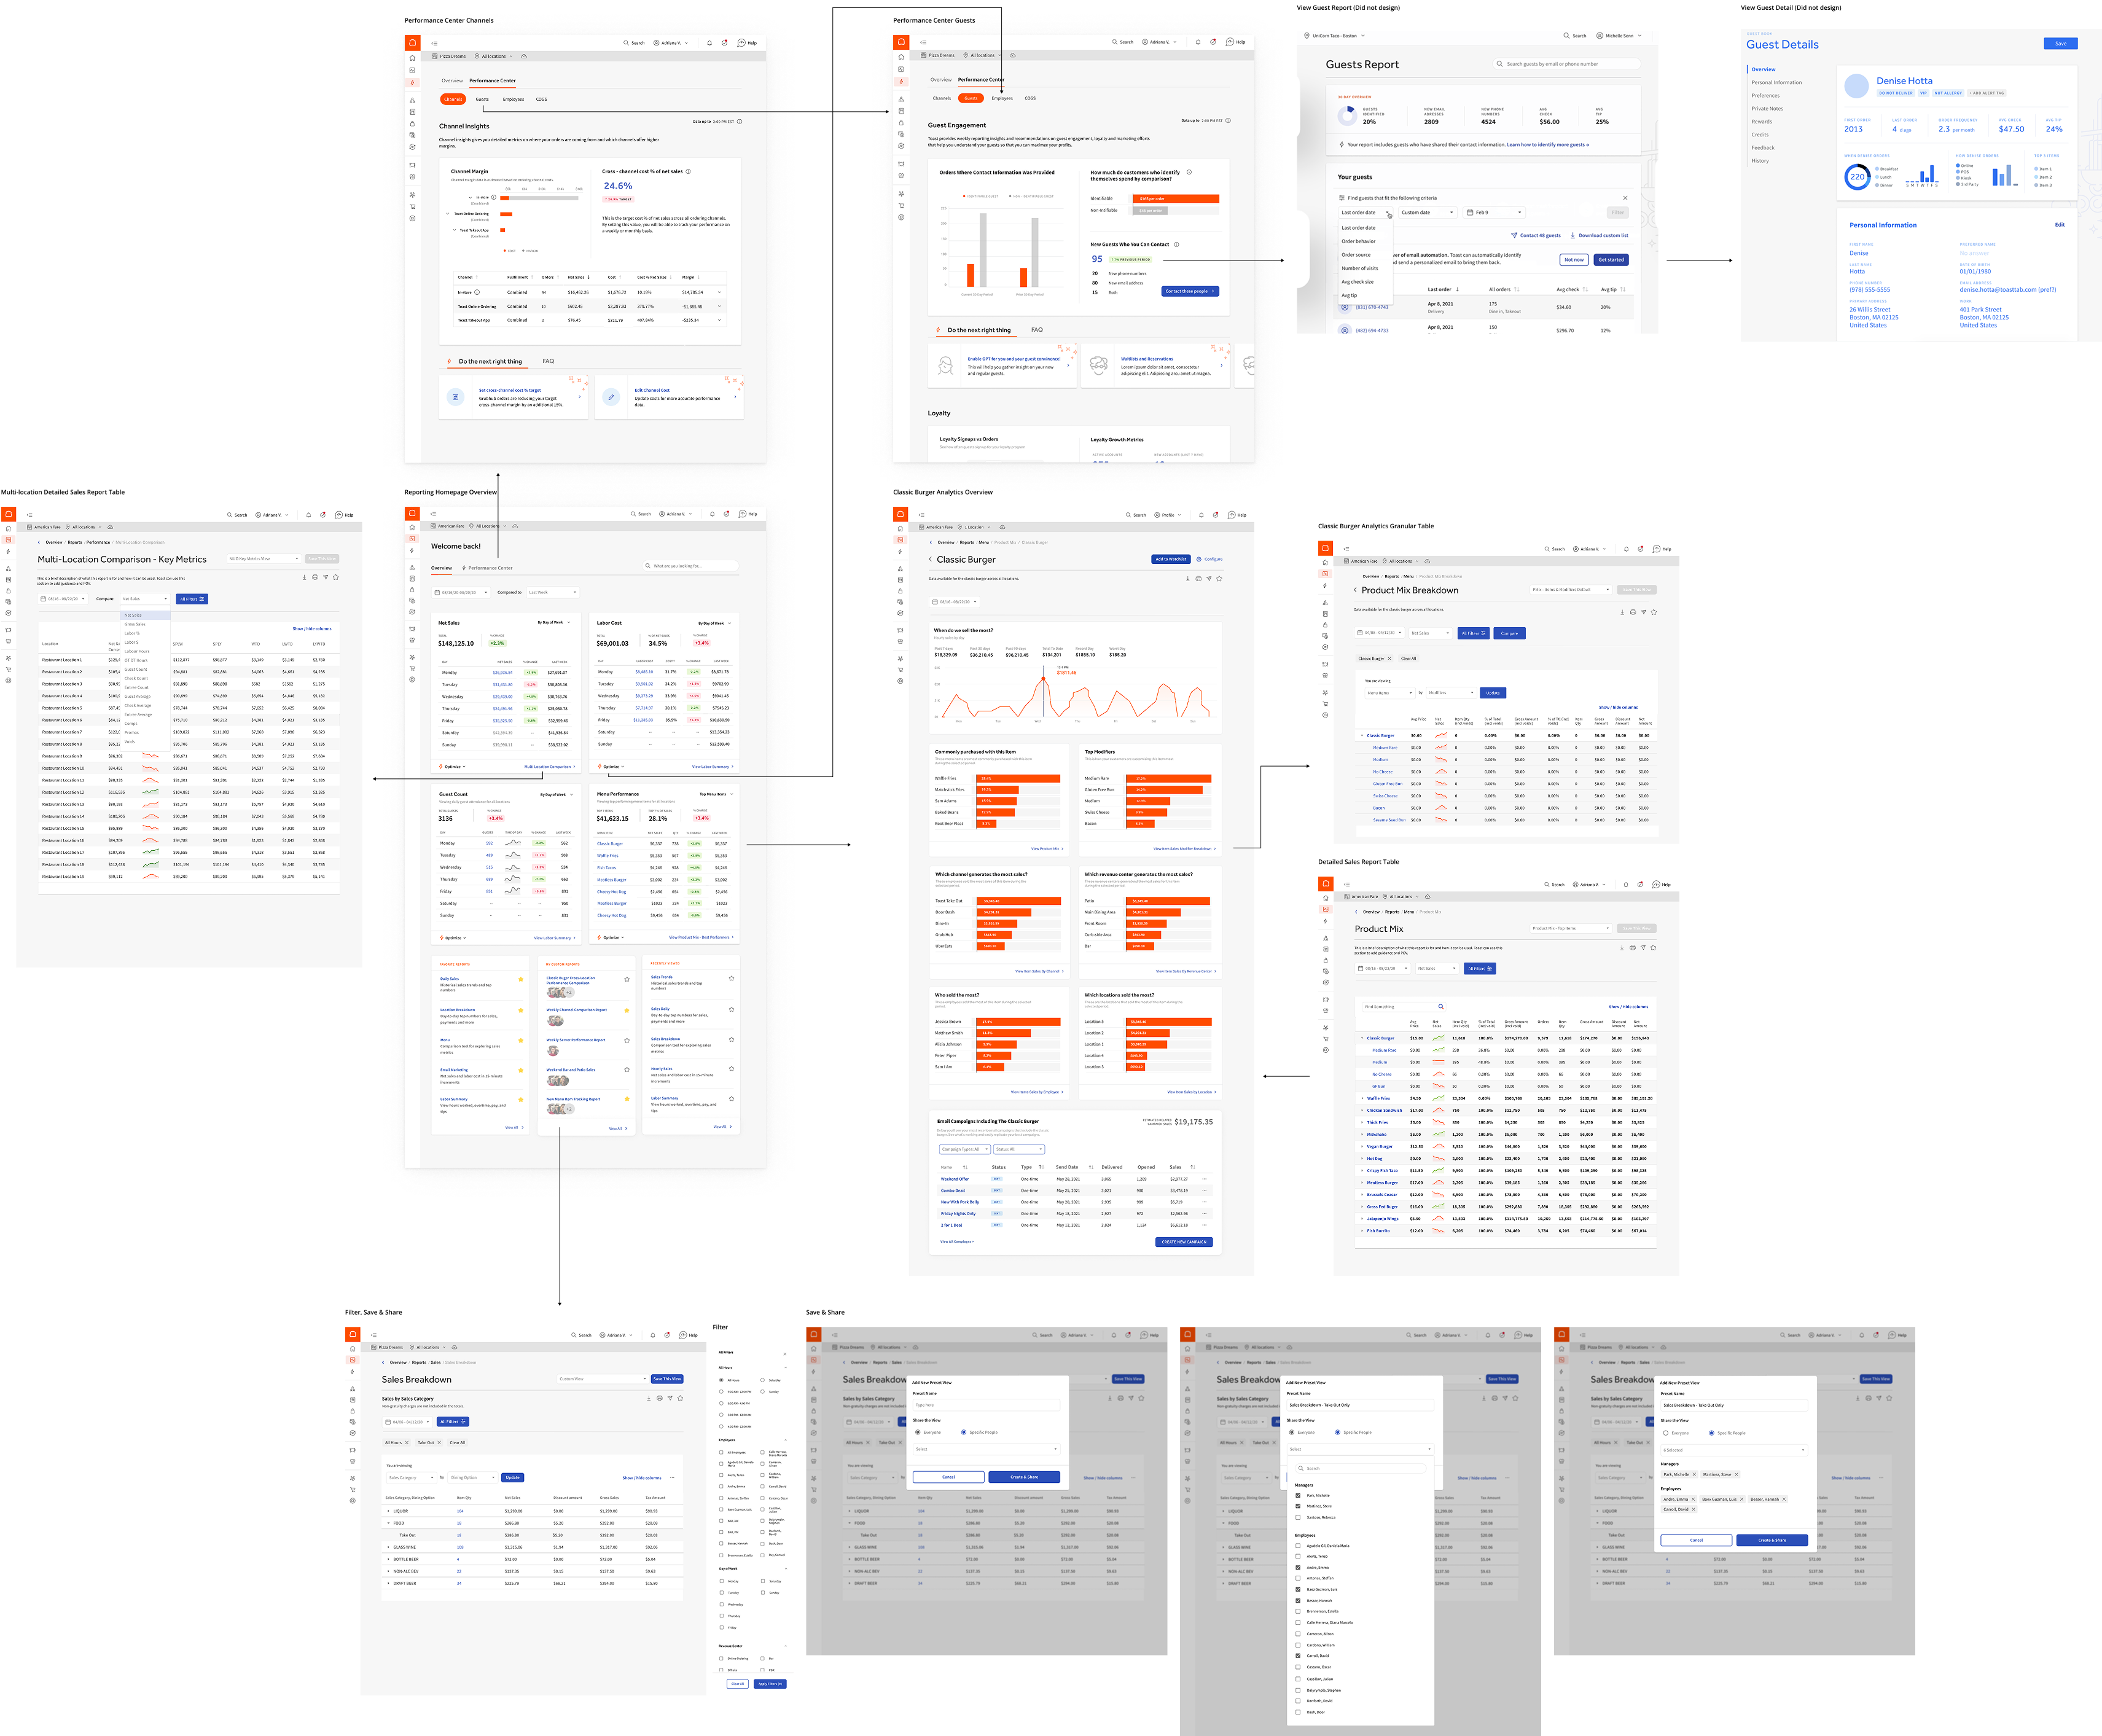
Reporting Paths Overview
Thank you!
Please reach out for any questions.
